By: Ryan Moreland (@ryanmoreland)
The CFSL has seen the use of advanced metrics to rank teams (like Easty’s Colley Rankings or Smitty’s PRI), but we haven’t yet seen advanced metrics used to rank players. Well, that is about to change. This is your first look at the JTR Advanced Metric.
What is JTR?
This metric was developed in a team effort between myself, Tony Papol (@SGEasty), and James Bayse (@jbayse1). Simply put, JTR is an advanced metric used to rank players by position. Starting with quarterbacks, we hope to use this metric to create position-based player rankings for every position in the league. JTR can rank an individual’s performance in a game, several games, or a season. This will give us the ability to rank each position weekly and by season. With this being said, it is our belief that the metric is more accurate over the course of a season than it is in a single game. Much like any other stat, a season is far more telling than a single game.
We are still working on all of the data and how each position will be graded, which will take some time. Our hope is to be able to have weekly positional rankings for every position in Season 17. But for now, here is a taste.
How JTR works?
JTR ranks players by their comparison to the league average using as unbiased stats as possible. By unbiased stats, we mean stats that don’t show a preference for one style of play over another. For example, we would expect a quarterback in an air raid system to throw the ball more often than a quarterback in a multiple set. So comparing the two based on completions wouldn’t be fair. Once we determine stats that we believe to be unbiased, we create a league average. Outperforming the league average earns a player positive points. Stats that fall below the league average will earn a player negative points. Points for each stat are calculated and combined with a base rating given to each player. The combination results in a player’s JTR metric score. 0 is the worst possible score and 100 is the best possible score.
For QBs, the stats we chose to use are completion percentage, yards per attempt, touchdown percentage, interception percentage, and unique rushing index. The rushing index attempts to exclude sacks from a quarterback’s rush totals to get a truer sense of them as a runner. Also, QBs cannot take negative points from the rushing index (outside of fumbles). This is because a running ability for a quarterback is a plus, but not a requirement. Being able to throw the ball effectively is.
JTR is not a predictive metric. It has no ability to tell the future, only measure what a player has done up to that point.
Note: This is a complicated system that is difficult to explain in an easily digestible way. If you have more questions about how it works, please reach out. We would be more than happy to answer your questions.
JTR QB Rankings
Note: These are not scores for how you performed this week, but rather how you performed so far this season. Also, MAC players were not used this week (Sorry MAC) but will be once they have more games to pull data from.
| Rank | Player | Team | JTR Score |
| 1 | Ryan Moreland | 92.193 | |
| 2 | Derrick Power | 90.650 | |
| 3 | Sam Dobbins | 88.304 | |
| 4 | Helix Myers | 85.854 | |
| 5 | Cece Range | 84.886 | |
| 6 | Mateo Walker | 81.802 | |
| 7 | Topher Foreman | 81.120 | |
| 8 | Tony Ellis | 79.964 | |
| 9 | Baker Thomas | 79.162 | |
| 10 | Ryan Ravenhill | 78.811 | |
| 11 | Ray Flash | 78.403 | |
| 12 | Moses King | 78.369 | |
| 13 | Logan Radloff | 77.015 | |
| 14 | Avery Ware | 71.186 | |
| 15 | Dylan Shumate | 65.652 | |
| 16 | Loki Gunderson | 63.044 | |
| 17 | Brantley Gauci | 55.026 | |
| 18 | Ayden Martinez | 50.145 | |
| 19 | Shaker Mayflower | 49.861 | |
| 20 | Charlie Sammons | 47.471 |
Findings
As you can see by the standings, JTR doesn’t value high yards and touchdown marks over efficiency. In fact, there are two quarterbacks with a top-five JTR that are not in the top ten in passing yards. Sam Dobbins is currently 12th and Helix Myers is 19th. Dobbins is tied for fifth in passing touchdowns and Myers is tied for 13th. So how did a quarterback with so few yards and TDs get so high on this metric? Because he takes shots downfield without throwing interceptions, has an impressive TD percentage, and is a talented scrambler.
Myers did not do so well in completion percentage. His 62.3% completion percentage is decently lower than the league average (67.8%), which cost him points. However, he did very well in every other metric. His 8.8 yards per attempt is the third-highest in the league. This tells us that even though he doesn’t throw often when he does he takes shots down the field. And despite taking shots, Myers hasn’t thrown many interceptions. His one pick in 69 passes gives him an INT% of 1.45%. That is the fourth-best among Power Two QBs. He has also thrown five touchdowns on those 69 throws, which gives him the third-best TD% in the Power Two. He is the only player that is in the top five for YPA, TD%, and INT%. Combine all that with his above-average running ability and you have an impressive 85.854 JTR score.
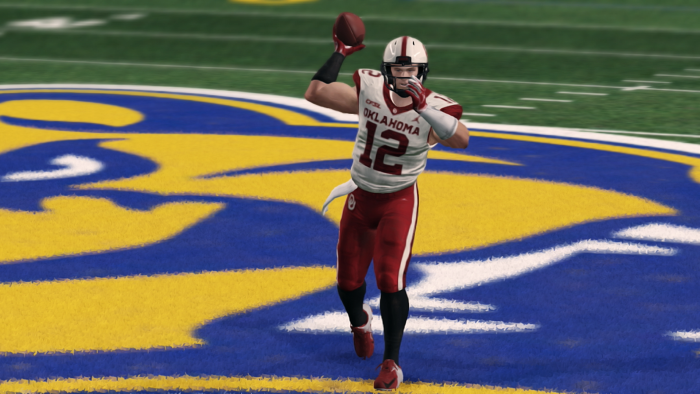
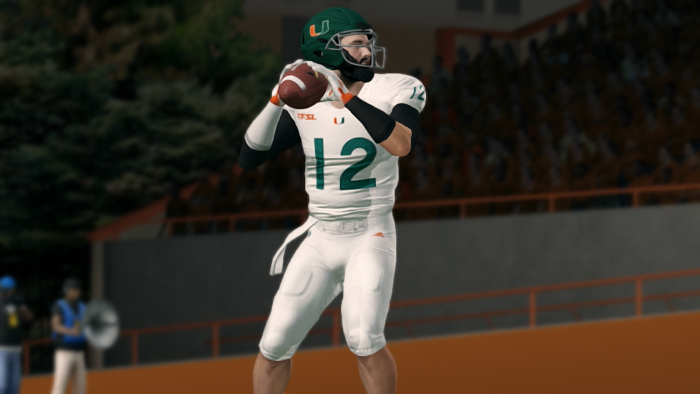
Interestingly enough, the current JTR leader Ryan Moreland didn’t lead in any statistical category. Moreland ranked second in completion and touchdown percentages, fifth in interception percentage, 8th in yards per attempt, and 11th in the rushing index. He was also one of just two players that didn’t record a negative in any of the five stat categories. The other was Miami freshman Mateo Walker.
There were several players that did well in most categories but had one that hurt their standings. For instance, Oklahoma’s Derrick Power had fantastic numbers, outside of his 4.88% interception percentage. This dropped his score by -2.38 points, meaning he would be in first if it had not been for this. West Virginia’s Tony Ellis put up solid numbers across the board except for his yards per attempt. Ellis’ 7.0 YPA is below the league average of 7.3, which ended up costing him a few points.
Lastly, a note on the future. Since this is based on the league average, every week the league average will change. That means that when a quarterback has a big game he will not only be boosting his own numbers but making it harder for his fellow QBs to score well. The opposite will also be true. A bad game will help lower the average and that quarterback’s personal score. Best of luck to all the QBs out there and keep an eye out for future JTR rankings in new positions.