By: Ryan Moreland
The opening week of Season 17 is complete and it is time to bring back the JTR QB rankings! For those who are new (or those who need a refresher) below is how the JTR rankings work. As always, thanks to Tony Papol (@SGEasty) and James Bayse (@jbayse1) for their help.
How JTR Works
JTR ranks players by their comparison to the league average using as unbiased stats as possible. By unbiased stats, we mean stats that don’t show a preference for one style of play over another. For example, we expect a quarterback in an air raid system to throw the ball more often than a quarterback in a multiple set. So comparing the two based on completions wouldn’t be fair. Once we determine stats that we believe to be unbiased, we create a league average. Outperforming the league average earns a player positive points. Stats that fall below the league average will earn a player negative points. Points for each stat are calculated and combined with a base rating given to each player. The combination results in a player’s JTR metric score. 0 is the worst possible score and 100 is the best possible score.
For QBs, the stats we chose to use are completion percentage, yards per attempt, touchdown percentage, interception percentage, passing yards per game, and unique rushing index. The rushing index attempts to exclude sacks from a quarterback’s rush totals to get a more accurate sense of them as a runner. Also, QBs cannot take negative points from the rushing index (outside of fumbles). This is because a running ability for a quarterback is a plus, but not a requirement.
JTR is not a predictive metric. It cannot tell the future. It can only measure what a player has done up to that point.
Note: This is a complicated system that is difficult to explain in an easily digestible way. If you have more questions about how it works, please reach out. We would be more than happy to answer your questions.
JTR QB Rankings
| Rank | Player | Team | JTR Score |
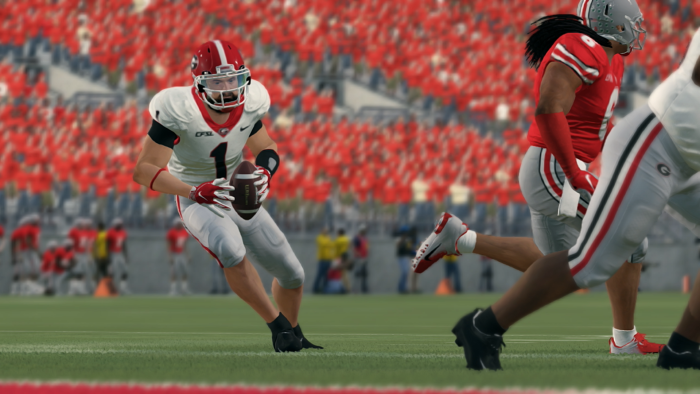
| 1 | Ludwig Friedman | Georgia | 97.224 |
| 2 | Helix Myers | Pittsburgh | 97.154 |
| 3 | Baker Thomas | Auburn | 95.491 |
| 4 | Loki Gunderson | Clemson | 90.734 |
| 5 | Tony Ellis | West Virginia | 86.789 |
| 6 | Ryan Ravenhill | Florida State | 86.569 |
| 7 | Avery Ware | Texas | 80.280 |
| 8 | Ayden Martinez | North Carolina | 71.071 |
| 9 | McKade Alber | Toledo | 67.817 |
| 10 | Moses King | Kentucky | 63.356 |
| 11 | Derrick Power | Oklahoma | 60.856 |
| 12 | Greg Cooksey | Eastern Michigan | 57.269 |
| 13 | Kyson Carey | Bowling Green | 57.236 |
| 14 | Beau Dale | Florida | 56.752 |
| 15 | Charlie Sammons | Notre Dame | 55.784 |
| 16 | Del Toro | Ohio | 54.163 |
| 17 | Cece Range | Alabama | 53.146 |
| 18 | Topher Foreman | Michigan | 52.364 |
| 19 | Shaker Mayflower | Kent State | 45.923 |
| 20 | Mateo Walker | Miami | 45.703 |
| 21 | Logan Radloff | Ohio State | 37.299 |
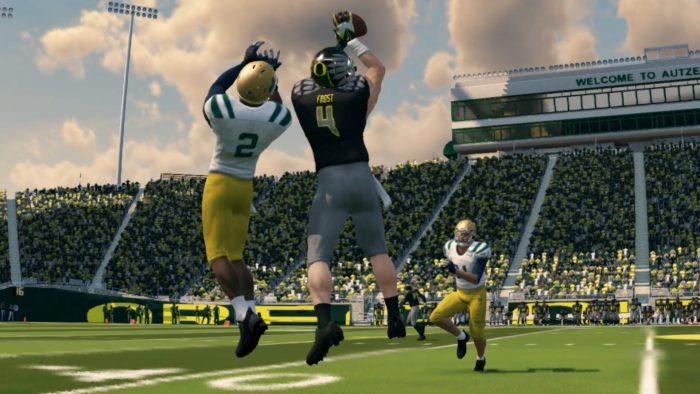
| 22 | Brantley Gauci | Oregon | 34.338 |
| 23 | Ryan Moreland | Oklahoma State | 32.042 |
| 24 | Terry Olliff | Northern Illinois | 24.990 |
| 25 | Sam Dobbins | Boise State | 22.774 |
| 26 | Dylan Shumate | Illinois | 21.344 |
Findings
The first thing I noticed when compiling the list was how much larger the spread between the top and bottom than it was the last time I did this. This is easily explained, however. It is not because QBs are getting worse or better, but that the difference between one game of action is a lot larger than the difference between two QBs throughout a season. I expect the gap to narrow as the season wears on.
The next thing I noticed was how many new names were at the top. I think a large reason we see so many new names is that many of them played teams that weren’t nearly as good as their team. You will notice that four of our top five played MAC teams this week. That does not mean they can’t keep high scores, just that the ease of competition helped them start high in the rankings. It will be up to them to keep it up when they get into conference play.
The same can be said about names were are used to seeing near the top. Names like Sam Dobbins, Ryan Moreland, and Mateo Walker are far lower than we saw them last season. Again, I believe this to be because of the quality of the opponents they played to start the season. Once we get further into the season I expect they will rise.
The last thing we will note is the players that didn’t go negative in any of the metrics. This means they were better than the average CFSL QB in every measurement we use. It is a very short list to start the season. Only the top-ranked QB, Ludwig Friedman managed a positive score in every metric. We will see if the talented young QB can stay atop after this coming season. Congrats Ludwig.