By: Ryan Moreland (@ryanmoreland)
How JTR Works
JTR ranks players by comparison to the league average using unbiased stats. By unbiased stats, we mean stats that don’t show a preference for one style of play over another. For example, we expect a quarterback in an air raid system to throw the ball more often than a quarterback in a multiple set. So comparing the two based on completions wouldn’t be fair. Once we determine stats that we believe to be unbiased, we create a league average. Outperforming the league average earns a player positive points. Stats that fall below the league average will earn a player negative points. Points for each stat are calculated and combined with a base rating given to each player. The combination results in a player’s JTR metric score. 0 is the worst possible score and 100 is the best possible score.
For QBs, the stats we chose to use are completion percentage, yards per attempt, touchdown percentage, interception percentage, passing yards per game, and unique rushing index. The rushing index excludes sacks from a quarterback’s rush totals to get a more accurate sense of them as a runner. Also, QBs cannot take negative points from the rushing index (outside of fumbles). This is because a running ability for a quarterback is a plus, but not a requirement.
JTR is not a predictive metric. It cannot tell the future. It can only measure what a player has done up to that point.
JTR Rankings
| Rank (Last Week) | Player | Team | JTR Score (Change) |
| 1 (1) | Loki Gunderson | Clemson | 91.326 (-6.453) |
| 2 (2) | Zeus Claydon | Florida State | 86.154 (+3.091) |
| 3 (4) | Del Toro | Notre Dame | 82.438 (+1.657) |
| 4 (11) | Beau Dale | Florida | 80.848 (+5.787) |
| 5 (3) | Ludwig Friedman | Georiga | 80.645 (-1.357) |
| 6 (8) | Derrick Power | Oklahoma | 78.867 (+1.567) |
| 7 (10) | Charlie Sammons | Kentucky | 78.577 (+3.390) |
| 8 (5) | Ryan Moreland | Oklahoma State | 77.276 (-2.291) |
| 9 (15) | Dylan Shumate | Illinois | 77.276 (+7.028) |
| 10 (7) | Avery Ware | Texas | 76.815 (-1.611) |
| 11 (9) | Topher Foreman | Michigan | 76.691 (+0.964) |
| 12 (6) | Baker Thomas | Auburn | 72.609 (-6.488) |
| 13 (12) | Ayden Martinez | North Martinez | 70.058 (-4.850) |
| 14 (24) | Cece Range | Alabama | 70.005 (+4.792) |
| 15 (17) | Sean Keohane | Kent State | 69.582 (+1.612) |
| 16 (22) | McKade Alber | Boise State | 69.487 (+3.946) |
| 17 (16) | Tony Ellis | West Virginia | 69.311 (+1.341) |
| 18 (14) | Mateo Walker | Miami | 67.846 (-4.011) |
| 19 (21) | Greg Cooksey | Eastern Michigan | 67.778 (+1.847) |
| 20 (13) | Brantley Gauci | Oregon | 66.369 (-6.369) |
| 21 (18) | Shaker Mayflower | Pittsburgh | 65.298 (-1.966) |
| 22 (19) | Andrei Belov | Ohio State | 63.102 (-3.838) |
| 23 (25) | Terry Olliff | Northern Illinois | 61.898 (-0.163) |
| 24 (20) | Sam Dobbins | Toledo | 59.950 (-6.816) |
| 25 (23) | Owen Dart | Ohio | 56.692 (-8.849) |
| 26 (26) | Kyson Carey | Bowling Green | 53.651 (-4.585) |
Findings
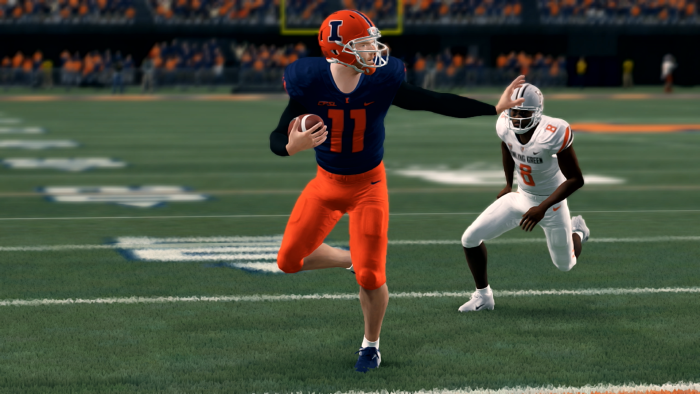
This week’s best improvement in score belongs to Illinois quarterback Dylan Shumate. His 446-yard, six-touchdown performance drastically improved his score. It also got his team a big win over Ohio State to secure Illinois a playoff spot. Other quarterbacks who improved their scores well this week were Florida’s Beau Dale and Alabama’s Cece Range.
Shumate had the biggest score increase, but he was not the biggest mover up the leaderboard. That honor belongs to Cece Range. Range threw for 602 yards and seven touchdowns in a massive win over Miami. This performance shot him ten spots up the rankings. That is one of the largest jumps we have ever seen in the CFSL, especially this late in the season.
