By: Ryan Moreland (@ryanmoreland)
How JTR Works
JTR ranks players by their comparison to the league average using as unbiased stats as possible. By unbiased stats, we mean stats that don’t show a preference for one style of play over another. For example, we expect a quarterback in an air raid system to throw the ball more often than a quarterback in a multiple set. So comparing the two based on completions wouldn’t be fair. Once we determine stats that we believe to be unbiased, we create a league average. Outperforming the league average earns a player positive points. Stats that fall below the league average will earn a player negative points. Points for each stat are calculated and combined with a base rating given to each player. The combination results in a player’s JTR metric score. 0 is the worst possible score and 100 is the best possible score.
For QBs, the stats we chose to use are completion percentage, yards per attempt, touchdown percentage, interception percentage, passing yards per game, and unique rushing index. The rushing index attempts to exclude sacks from a quarterback’s rush totals to get a more accurate sense of them as a runner. Also, QBs cannot take negative points from the rushing index (outside of fumbles). This is because a running ability for a quarterback is a plus, but not a requirement.
JTR is not a predictive metric. It cannot tell the future. It can only measure what a player has done up to that point.
Note: This is a complicated system that is difficult to explain in an easily digestible way. If you have more questions about how it works, please reach out. We would be more than happy to answer your questions.
| Rank (Last Week) | Player | Team | JTR Score (Change) |
| 1 (3) | Loki Gunderson | Clemson | 90.273 (+4.525) |
| 2 (6) | Kyson Carey | Bowling Green | 87.337 (+6.568) |
| 3 (18) | McKade Alber | Toledo | 86.628 (+20.477) |
| 4 (4) | Charlie Sammons | Notre Dame | 85.895 (+2.821) |
| 5 (10) | Del Toro | Ohio | 81.770 (+2.736) |
| 6 (1) | Cece Range | Alabama | 80.869 (-18.974) |
| 7 (19) | Moses King | Kentucky | 78.336 (+13.958) |
| 8 (17) | Avery Ware | Texas | 77.478 (+9.337) |
| 9 (9) | Derrick Power | Oklahoma | 76.504 (-3.154) |
| 10 (7) | Ayden Martinez | North Carolina | 76.312 (-4.376) |
| 11 (14) | Mateo Walker | Miami | 75.939 (+5.307) |
| 12 (5) | Tony Ellis | West Virginia | 74.348 (-8.214) |
| 13 (2) | Baker Thomas | Auburn | 74.065 (-14.253) |
| 14 (16) | Topher Foreman | Michigan | 73.808 (+4.711) |
| 15 (11) | Ludwig Friedman | Georgia | 70.231 (-5.980) |
| 16 (13) | Ryan Ravenhill | Florida State | 68.869 (-3.051) |
| 17 (12) | Helix Myers | Pittsburgh | 67.153 (-7.636) |
| 18 (15) | Brantley Gauci | Oregon | 66.370 (-3.970) |
| 19 (23) | Shaker Mayflower | Kent State | 65.050 (+6.075) |
| 20 (20) | Greg Cooksey | Eastern Michigan | 62.138 (-1.658) |
| 21 (8) | Sam Dobbins | Boise State | 61.273 (-18.526) |
| 22 (24) | Logan Radloff | Ohio State | 59.424 (+5.112) |
| 23 (21) | Beau Dale | Florida | 57.973 (-2.667) |
| 24 (26) | Terry Olliff | Northern Illinois | 54.490 (+6.272) |
| 25 (25) | Ryan Moreland | Oklahoma State | 53.926 (+0.847) |
| 26 (22) | Dylan Shumate | Illinois | 46.496 (-12.954) |
Findings
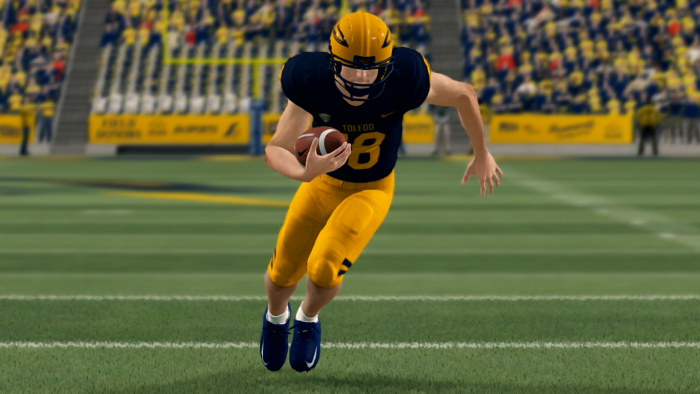
McKade Alber shot up the leaderboard this week thanks to an incredible performance against Eastern Michigan. He threw for a new single-game CFSL record 744 yards and added a Toledo record of eight touchdowns. This was good enough to improve his JTR score by more than 20 points. This jump in points also moved him up 15 spots. This was the largest jump up the leaderboard this week.
Other notable improvements include Kentucky’s Moses King and Texas’ Avery Ware. King 13 point boost was enough to improve him by 12 spots on this leaderboard. Ware moved up nine spots in the rankings thanks to a nine-plus points boost.
